
MENU


Data-backed insights proving why real-time observability separates profitable AI agents from failed experiments
AI agents generate millions of micro-transactions daily, yet most builders fly blind without proper usage tracking. The observability market reached $2.9 billion in 2025 and shows no signs of slowing, with enterprises finally recognizing that visibility into agent performance determines profitability. Nevermined Pay addresses this critical gap through its Observability and Insights Dashboard, delivering real-time metering, revenue analytics, and audit-ready transparency that transforms raw usage data into actionable intelligence for AI agent monetization.
The observability market size reached $2.9 billion in 2025 and continues expanding at a 15.9% CAGR. This growth reflects enterprises recognizing that visibility into system performance directly impacts revenue. For AI agent builders, this trend signals increased competition and higher customer expectations for transparent usage tracking.
The specialized data observability market reached $3.15 billion in 2025 and is forecast to hit $5.45 billion by 2030. This parallel growth demonstrates that organizations need visibility not just into systems but into the data flowing through them. AI agents processing millions of requests require this level of granular tracking.
Despite market growth, 73% of surveyed organizations still lack comprehensive observability across their technology infrastructure. This gap creates opportunity for AI agent builders who implement proper dashboards to differentiate through transparency. Nevermined's documentation provides guidance on achieving complete visibility.
Just 25% of organizations had achieved full-stack observability by 2024, leaving the vast majority flying partially blind. This statistic underscores the competitive advantage available to AI builders who prioritize comprehensive usage tracking from day one.
A striking 56% of companies are still piloting observability solutions or exploring use cases, and a total of 76% are considered well short of achieving full-stack enterprise observability. This maturity gap means AI agent builders have time to establish best practices before the market matures.
Dashboard deployment has become mainstream, with 54% of organizations now using dashboards as a core capability. This adoption rate demonstrates that visual interfaces for usage data have moved beyond early adopter status. Nevermined Pay's Observability Dashboard provides this visibility specifically designed for AI agent monetization.
When asked about critical data types, 64% of respondents prioritized metrics over other observability signals. This finding validates the importance of quantitative usage tracking for AI agents, where per-token, per-API-call, and per-GPU-cycle metrics determine profitability.
Beyond metrics, 56% identified logs as critical to their approach. For AI agent builders, this translates to maintaining detailed records of every interaction, enabling audit trails that enterprise buyers increasingly demand.
The typical enterprise now runs 8 observability capabilities across their stack. This complexity creates integration challenges that unified platforms like Nevermined solve through consolidated AI agent monitoring.
More than one-third of organizations have expanded to 10 or more observability capabilities. This proliferation indicates growing recognition that different aspects of system performance require specialized tracking.
Integration has become standard practice, with 87% combining at least one business-related data type with their technical telemetry. For AI agents, this means connecting usage metrics to revenue data for true profitability visibility.
The business case is clear: 75% of organizations report positive returns from their observability investments. This majority satisfaction rate demonstrates that proper usage tracking pays for itself.
Organizations achieve a median 4x return on observability investments. This dramatic payback makes observability one of the highest-ROI technology investments available to AI builders.
The best-performing 18% of organizations realize 3-10X returns from their observability investments. This exceptional performance tier demonstrates what comprehensive dashboards can deliver when properly implemented.
The median ROI doubled from 2x to 4x between 2023 and 2024, indicating that organizations are becoming more effective at extracting value from their observability investments. This trend rewards early adopters who master usage analytics.
Beyond cost savings, 65% of respondents report that their observability practice directly and positively impacts revenue generation. For AI agent builders, this validates the connection between usage visibility and monetization success.
More than half of organizations, 58% specifically, receive $5 million or more in annual value from their observability investments. This substantial value creation justifies enterprise-grade solutions like Nevermined's platform.
The industry is consolidating, with average tool count declining from 6 to 4.4 tools over two years. This 27% reduction reflects recognition that fragmented tooling creates more problems than it solves.
Over half of organizations, 52% specifically, plan to consolidate their observability tools onto unified platforms within two years. This consolidation trend favors comprehensive solutions that handle multiple aspects of AI agent monitoring.
Despite consolidation trends, 88% of organizations still use multiple monitoring tools, creating data silos and integration overhead. Nevermined's unified approach to AI agent observability addresses this fragmentation directly.
Organizations using a single observability tool spend 65% less annually ($700,000 compared to $2 million) than those using multiple tools. This cost differential makes consolidated platforms significantly more economical.
Integration priorities are clear: 80% of organizations plan to integrate or have already integrated IT monitoring with their observability tools. For AI agents, this means connecting usage data to broader infrastructure metrics.
Open-source adoption is substantial, with 51% of organizations using open-source solutions for one or more observability capabilities. This trend aligns with Nevermined's open-protocol approach that avoids vendor lock-in.
The stakes are enormous: high-impact outages carry a median cost of $2 million per hour, approximately $33,333 per minute. For AI agent providers, undetected failures translate directly to lost revenue and damaged relationships.
Organizations with comprehensive observability experience outages with costs reduced by half compared to those without full visibility. This 50% cost reduction demonstrates the financial value of complete usage tracking.
The downtime reduction is dramatic: organizations with full-stack observability experience 79% less downtime annually (70 hours compared to 338 hours). Nevermined's tamper-proof metering system provides this level of comprehensive visibility.
Frequency matters: 38% of organizations experience high-business-impact outages at least once per week. Without proper dashboards, AI agent builders risk similar frequency of undetected failures.
Alert fatigue creates real consequences: 73% report experiencing outages due to ignored or suppressed alerts. This statistic underscores the need for intelligent alerting systems that surface critical issues without overwhelming operators.
Speed matters for incident response. Organizations with comprehensive observability detect high-impact outages 7 minutes faster with an average MTTD of 28 minutes versus 35 minutes without full visibility.
When asked about business benefits, 55% of leaders cited reduced unplanned downtime as the primary value from observability. This prioritization validates focusing dashboards on availability and reliability metrics.
Half of organizations, 50% specifically, cite improved overall operational efficiency as a top business benefit from observability. For AI agent builders, this efficiency translates to higher margins on every interaction.
The discovery benefit is significant: 59% of organizations discovered performance issues they did not realize they had through observability. This hidden cost identification is precisely what Nevermined Pay's dashboard surfaces for AI agents.
Proactive detection capabilities have matured: 58% of organizations gained the ability to detect and respond to performance issues before users or customers are impacted. This preemptive capability protects both revenue and reputation.
Performance differentiation is substantial: high-performing teams generate ROI that is 53% higher than their peers. This gap rewards organizations that invest in comprehensive observability practices.
Enterprise commitment is clear: 67% of organizations spend at least $1 million per year on observability. This substantial investment reflects the critical nature of usage tracking for business operations.
Nevermined Pay delivers bank-grade enterprise-ready metering, compliance, and settlement so every model call turns into auditable revenue. The platform's ledger-grade metering and dynamic pricing engine enable credit-based settlement with 5x faster book closing and margin recovery. Through x402 integration, Nevermined extends advanced agent payment capabilities that support autonomous agent-to-agent transactions without human intervention.
For AI agent builders targeting enterprise customers, tamper-proof usage records become table stakes. Every usage record in Nevermined's system is signed and pushed to an append-only log at creation, making it immutable. This zero-trust reconciliation model satisfies enterprise procurement teams requiring audit-ready transparency.
Observability investments must translate to profitability improvements. These final statistics demonstrate how usage analytics drive financial outcomes.
The median annual observability spend across organizations is $1.95 million, while the median annual value received is $8.15 million. This 4x value multiplier validates investment in comprehensive usage tracking.
Engineering productivity benefits are equally compelling. Organizations using a single observability tool spend 50% less engineering time addressing disruptions than those using multiple tools. With 33% of engineering time currently spent addressing disruptions, this efficiency gain represents significant recovered capacity.
Valory cut deployment time of their payments and billing infrastructure for the Olas AI agent marketplace from 6 weeks to 6 hours using Nevermined, clawing back $1000s in engineering costs. This real-world result demonstrates how purpose-built observability for AI agents accelerates time-to-market while reducing operational overhead.
For AI agent builders ready to implement comprehensive usage tracking, Nevermined's documentation provides step-by-step guidance on integrating the Observability Dashboard with existing agent infrastructure.
Based on these statistics, AI agent builders should prioritize:
Flex Credits within Nevermined Pay enable prepaid consumption-based billing that aligns with these priorities. Users can monitor credit burn rate in real-time through the dashboard, avoiding surprise overruns while maintaining predictable spend patterns.
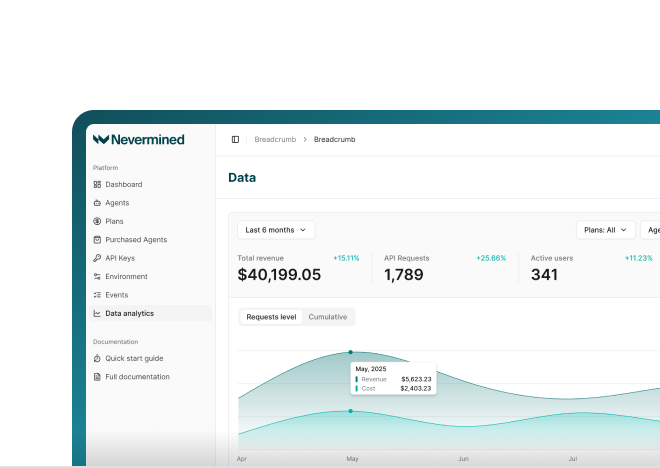
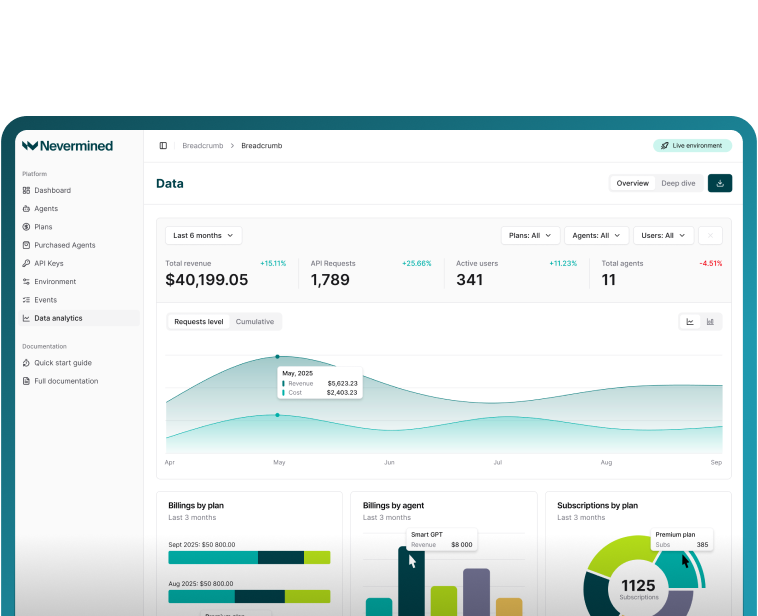
The Nevermined Observability Dashboard provides visibility into agent performance, user behavior, and revenue analytics. You can track per-token, per-API-call, and per-GPU-cycle metrics in real-time, matching the 64% of organizations who cite metrics as their most critical data type. The dashboard surfaces hidden costs and missed opportunities while identifying features driving growth for scaling decisions.
Similar to how 59% of organizations discovered previously unknown performance issues through observability, Nevermined's dashboard reveals cost drivers that traditional billing systems miss. Real-time metering tracks every request against pricing rules, exposing margin erosion from underpriced operations or excessive third-party API consumption.
Yes, every usage record is signed and pushed to an append-only log at creation, making it immutable. The exact pricing rule is stamped onto each agent's usage credit, allowing any developer, user, auditor, or agent to verify that usage totals match billed amounts per line-item. This audit-ready transparency addresses why 67% of organizations invest at least $1 million annually in observability.
The dashboard integrates with Nevermined Pay's support for three pricing models: usage-based (cost-inferred, pay-per-request), outcome-based (charging for results achieved), and value-based (percentage of ROI generated). This flexibility matches the 58% of organizations who integrate business data with technical telemetry for complete profitability visibility.
Integration occurs through a low-code SDK available in TypeScript and Python. The three-step process takes under 20 minutes and automatically captures usage data for the dashboard. Visit Nevermined's documentation for detailed implementation guidance that helps avoid the fragmentation faced by the 88% of organizations still using multiple monitoring tools.
See Nevermined
in Action
Real-time payments, flexible pricing, and outcome-based monetization—all in one platform.